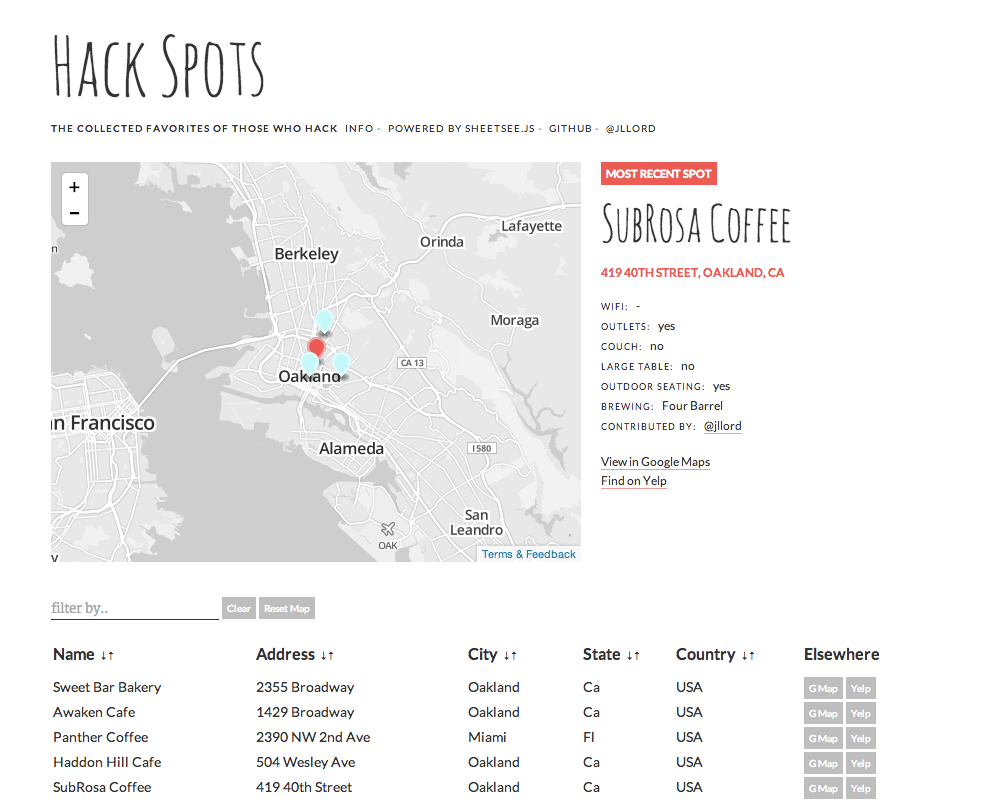
Cluster close markers together on the map
Hi!
This is the code for a website that shows the spots myself, my friends (or Twitter friends) have found to be excellent hacking spots around the whole wide world.
Fork -n- Go!
In a bit I'll do some more refining (and documentation) - but here's a fun fact:
This repo only has a gh-pages branch, which means as soon as you fork it, you have a hosted and live version of it yourself!
Next, create a spreadsheet with the same column headers as the original.
Click on the index.html file, click edit and change line 118 (or thereabouts) it looks like:
    document.addEventListener('DOMContentLoaded', function() {
	  	var gData
	  	var URL = "0Ao5u1U6KYND7dFVkcnJRNUtHWUNKamxoRGg4ZzNiT3c"
			Tabletop.init( { key: URL, callback: showInfo, simpleSheet: true } )
    })
Replace the existing spreadsheet URL key with your spreadsheet's key. You'll find that by clicking (in Google Spreadsheets) File > Publish to the Web > Start Publishing, it will then display the key in a window. 
Commit those changes and LIKE WOAH you now have a version of this website hooked to a spreadsheet that you can distrubute however you'd like.
You can find your version at yourGitHubName.github.io/theReposName (in this case /hack-spots).
But How?
A Google Spreadsheet holds all the data and it is connected to this website using the goodies in sheetsee.js. Everytime you visit the website, you'll have the most up to date data that has been entered into the spreadsheet.
